Sunday, May 10, 2015
Monday, May 4, 2015
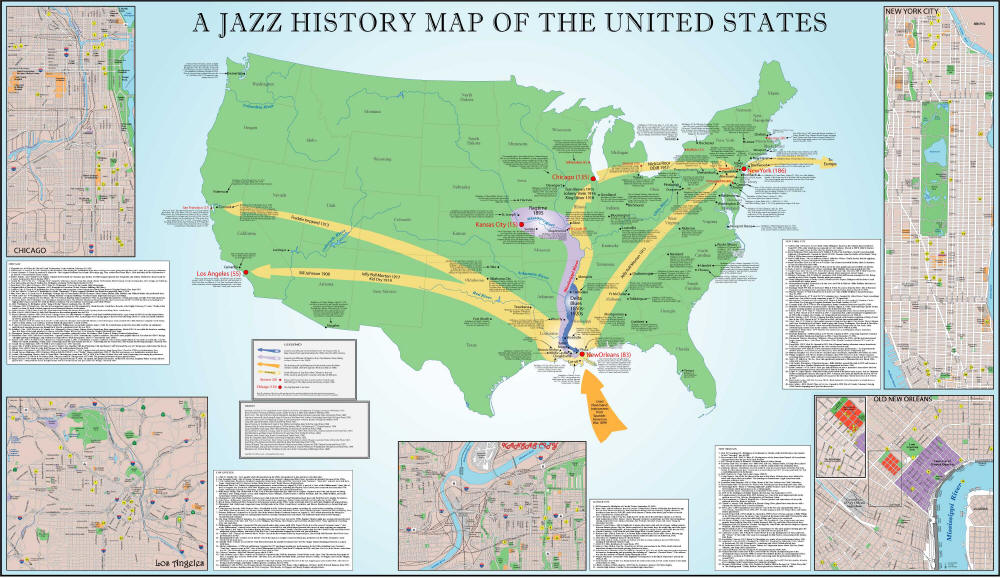
Map 10
Awesome Jazz Graphics
I found this map after I had started my research, and I think they show what I wanted to show much better.


Saturday, May 2, 2015
Monday, April 27, 2015
Sunday, April 26, 2015
Friday, April 24, 2015
Monday, April 6, 2015
Final Project Proposal
For my final project I would like to create a map that depicts the history of Jazz music in the U.S and the different styles that arise throughout its history. I would like to start with a little bit of Ragtime and Blues, since these are the predecessors of Jazz then transition to Jazz. I will use flash to create my map and it will include a movable timeline that the user can control popups that give background on the different genres of Jazz that arise throughout time. I will show where the genre first appears and show how Jazz traveled throughout the U.S starting in New Orleans. I will also give information on some key players in Jazz in the different genres and hopefully be able to give a sample of their music, possibly using buttons?
http://www.directionsmag.com/images/newsletter/2005/03_23/Jazz_Map1_lg.jpg
Monday, March 30, 2015
Monday, March 23, 2015
Jim Crow Map #6

Monday, March 16, 2015
US Mexican War
http://www.pbs.org/kera/usmexicanwar/timeline_flash.html
 I like how the morphs in this map are really simple and pause at each important year in the war. I also like how you have the ability to pick the year you want or you can play the map through. the morphs show the disputed land and the land occupied by each country.
 I like how the morphs in this map are really simple and pause at each important year in the war. I also like how you have the ability to pick the year you want or you can play the map through. the morphs show the disputed land and the land occupied by each country.
Monday, March 2, 2015
Loss of Native American Land
http://invasionofamerica.ehistory.org/
 The map shows the coming of Europeans to America and there affect on the native population. Overtime you can see the amount of land the natives have continues the shrink until they are pushed onto tiny reservations. I like how it gives you the option to either let the map play itself through time or you can pick a time period you want to look at.

Green Map of Baltimore
http://www.opengreenmap.org/greenmap/baltimore-regional-green-map
 This map shows different areas of Baltimore that area sustainable, or considered "green". It gives you the option to turn on and off different aspects of the map such as sustainable living, nature, and culture and society. Each of these categories can also be expanded to include more information and goes more into depth. You have the option to turn and off the layers you want. If you have all of them on it makes the map extremely cluttered. On the map each point of interest can be toggled over and you are given information on that point and what can be found there whether it be an activity, store, farm, etc.

Wednesday, February 25, 2015
Monday, February 9, 2015
Banda Aceh


Prior to the tsunami in December of 2004, you can see a complete coastline that is fairly populated with buildings and rice fields. The barrier island was flooded out after the tsunami along with the main road on the island. Most of the buildings in this area are gone and looks like barren land. A lot of the forest area has been flooded out also. The land behind the barrier island was a little less impacted than island itself. You can still see some difference. In June the rice fields are clearly divided, but after the Tsunami there are not clear divisions between fields. The bridge found on the left side of the image in December seems to be damaged also along with the main roads.
Monday, January 26, 2015
Interactive Map
http://flowingdata.com/2015/01/20/how-americans-get-to-work/

I found this map quite interesting, just by highlighting various transportation mechanisms, you can tell where major cities are and where rural areas are. If you get rid of the carpool and driving alone, you can easily see where major public transportation is and these fall near cities, such as Chicago, Washington D.C. and New York. Areas with a high percent of people who walk, seem to be small towns and where people would maybe just work in their town, like Alaska or A small county in Colorado called San Juan, which happens to be the least populous county in Colorado.
Subscribe to:
Comments (Atom)